ニュース

研究室旅行でつくばに行きました! We went to Tsukuba on the lab trip!

昨日12/10(日)に研究室旅行でつくばへと行きました!研究室のメンバー全員で行くことはできませんでしたが、5人で楽しく様々な博物館を巡りました。

地図と測量の科学館では、図化機の大きな機械を見て、また手と足でハンドルなどを操作して等高線を描くのだと想像すると大変さが想像できました。習得するまで相当の時間がかかったのだろうなと感じました。他にも三角点で使われる80kg以上の石を持ち上げてみたり、目測が体験できるところで目測をしてみたり初めての訪問でしたが、楽しく過ごすことができました!

地質標本館では、様々な火山の過去の噴火とそれに伴う成り立ちが色付きで分かりやすく見ることができました。僕自身火山の研究を行っているので、様々な成り立ちの火山を見ることができ、地図で見ていた時の記憶と相まって懐かしさも感じられる展示でした。

筑波宇宙センターでは、ガイドの方に説明をしていただきながら衛星やロケットの変遷を知ることができました。水循環や温室効果ガス濃度などを計測する人工衛星もあり、社会基盤学科で学んできたことと繋がりがあり、世界的な問題を解決するツールとしての人工衛星としてより身近に感じられました。

充実した1日を過ごせたので、また研究も勉強も頑張っていこうと思います!!


Yesterday, 12/10(Sun.), we went to Tsukuba on a lab trip! It was not possible for all the lab members to go together, but the five of us had a lot of fun visiting various museums.

At the Science Museum of Map and Survey, we saw the big machine of the stereoplotter and I could imagine how hard it is to draw lines with controlling hands and feet. I also tried lifting a stone weighing more than 80 kg, which is used in the triangulation point, and I tried eyeballing!

At the Geological Museum, I was able to see the past eruptions of various volcanoes and the accompanying formation in an easy-to-understand manner with colored displays. As I research volcanos, I was able to see volcanoes of various origins, which combined with my memories of looking at them on a map, gave me a sense of nostalgia.

At the Tsukuba Space Center, I was able to learn about the evolution of satellites and rockets with the help of a guide. There were also satellites measuring the water cycle and greenhouse gas concentrations, which were connected to what we had studied in the Department of Civil Engineering and made us feel more familiar with satellites as a tool for solving global problems.

I had a fulfilling day, and I will do my best in both my research and studies again!

投稿者|嶋野

第6回学生ゼミが開催されました The sixth student seminar was held.

12/11(月)に第6回学生ゼミが開催されました.
今回はD3の邱さんが「因果探索づく相互作用着目した深層学習ベースの歩行者経路予測」と題して博論研究の進捗を発表しました.

前回まで話のあった効率的な前処理方法や、歩行者間の時空間グラフを入力として深層学習手法による歩行者軌跡の経路予測に加えて、今回は統計的因果探索を用いて歩行者間の関係を見る話がありました。現在フランスに留学中のOB稲福にも来ていただき、因果探索の方法論や適用時の課題について活発な議論ができたと思います。

次回はB4坂番さんと私M2の片山の発表です。


The 6th student seminar was held on 12/11 (Mon.).

Ms Qiu (D3) presented her research progress entitled “Deep LearningBased Pedestrian Trajectory Prediction Focusing on Interaction Modeling through Causal Discovery“.

In addition to the previously discussed efficient pre-processing methods and pedestrian trajectory predictions using deep learning methods with spatiotemporal graphs between pedestrians as input, this time she talked about using statistical causal search to look at the relationships between pedestrians. We had a lively discussion about the methodology of causal search and challenges in its application.

Next time, Katayama (M2) and Sakaban (B4) will present.


投稿者|片山

岡村杯結果発表! Okamura Cup results announced!

10月末から行われてきた岡村杯の3試合が終了しました。地域/情報研究室は交通グループとして交通研、景観研との合同チームで試合に出ました。

試合の結果は下のようになりました。

予選
第1試合:vs地盤 17-9
第2試合:vs橋梁 9-9
1勝1分けで1位で予選を通過しました!

準決勝
vsB3 10-10(延長8回、じゃんけんで負け)
延長戦までもつれ同点のまま試合が終了し、最後に行われたじゃんけんで惜しくも敗退となってしまいました。

優勝は建マネ・国Pチームでした!
3位決定戦が開催されるのかは分かりませんが、今年は6チームの中で3or4位という結果になりました。


Three matches of the Okamura Cup, which has been held since the end of October, have been completed. The Regional Planning and Information Lab participated in the matches as a joint team with the Transportation Lab and the Landscape Lab Institute as the Transportation Group.

The results of the matches were as follows.

Preliminary Round
Game1(vs Geotech Lab)17-9
Game2(vs Bridge Lab) 9-9
We qualified in 1st place with 1 win and 1 draw!

Semifinals
(vs B3) 10-10 (lost by rock-paper-scissors-scissors)
The game went into overtime and ended in a tie, and the final game was played as a rock-paper-scissors game, and the team regrettably lost the game.

The winner of Okamura Cup was the Construction Management and International Project team! I don’t know if a third-place game will be held, but this year we ended up in third or fourth place among the six teams.

投稿者|嶋野

11月研究室ゼミが開催されました!  November lab seminar was held!

11/22(水)に11月の研究室ゼミが開催されました。
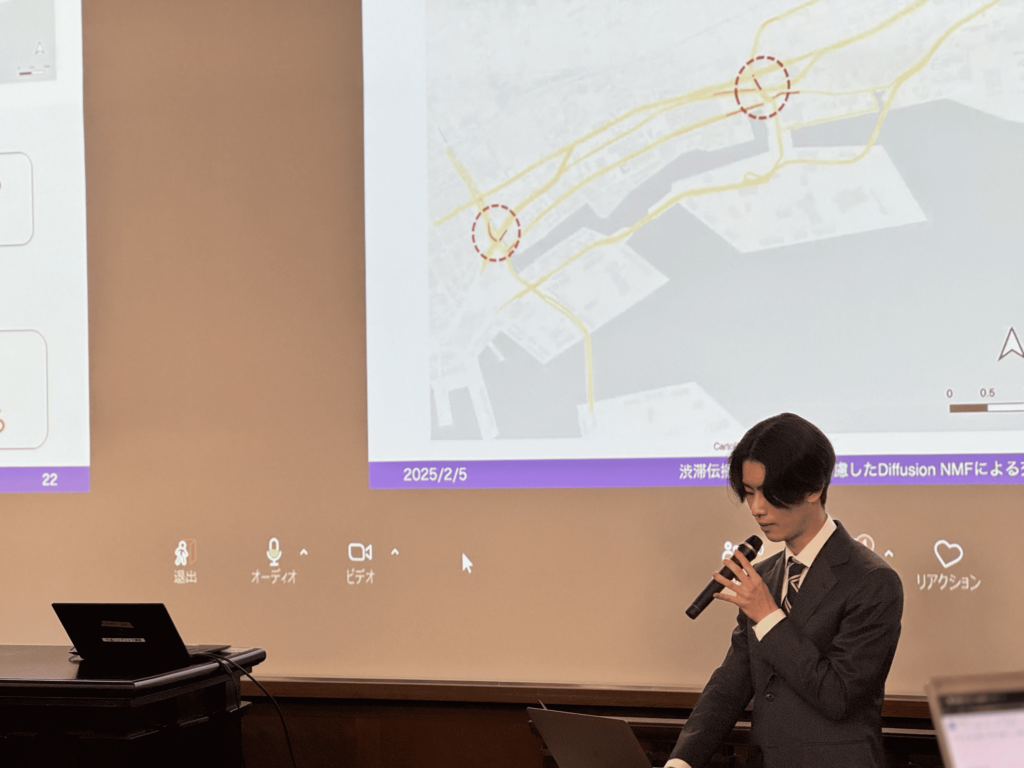
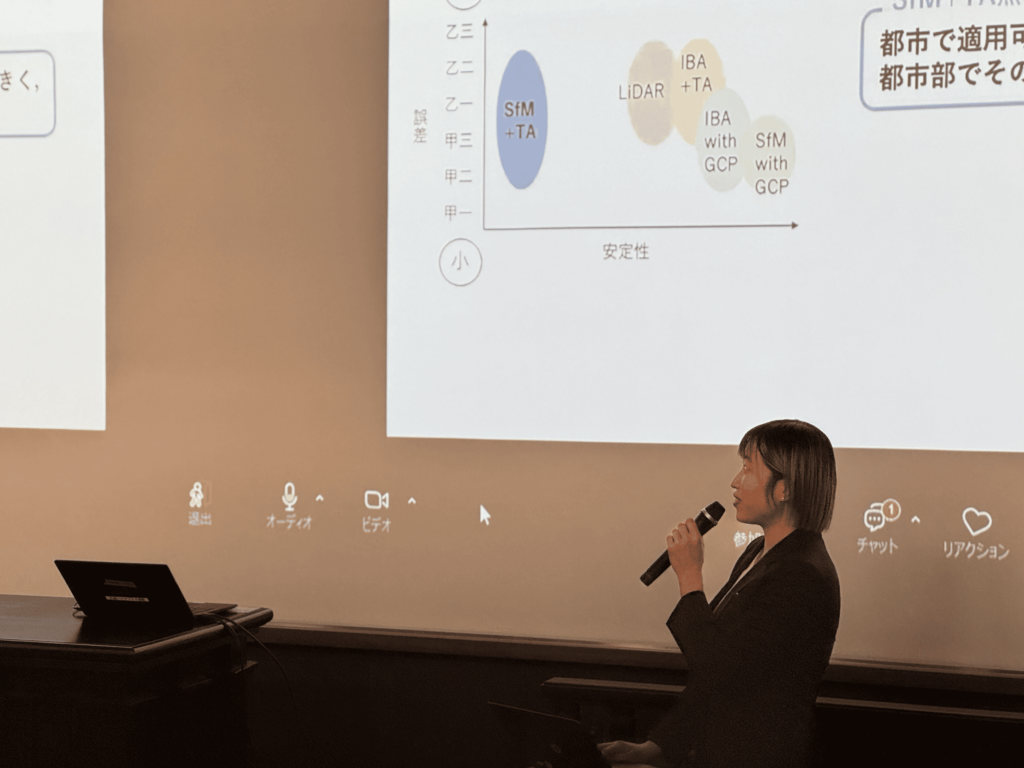
発表者はM2の片山さんと嶋野でした。
僕はしばらくの間、データを作るためにGISソフトを操作していたために進捗報告として結果を示すことができず、あまり多くのことを言うことができませんでした… しかし、研究の目的と目指すべき結果との整合性についてなどを指摘していただき、作業を進めながらも目標として何を目指すべきなのか考え続けたいと思います。

12月にも次の研究室ゼミが開催される予定です。その時は、B4の坂番さんと嶋野、M2の片山さんから発表する予定です。
良い発表をして、良い年を迎えられるように頑張っていきたいと思います!


The lab seminar was held on November 22(wed). Presenters were Katayama-san from M2 and me from B4. I could not show the results as a progress report because I was operating GIS software to create data for a while, so I could not say much… However, they pointed out the consistency between the purpose of the research and the results we should aim for, and I would like to continue to think about what we should aim for as a goal while working on the project.


The next laboratory seminar will be held in December. At that time, Sakaban-san and me from B4 and Katayama-san from M2 will give presentations. I will do my best to make a good presentation and have a good New Year!

投稿者|嶋野

第5回学生ゼミが開催されました The fifth student seminar was held.

11/27(月)に第5回学生ゼミが開催されました.
D1の諸田さんとB4の嶋野くんが研究進捗を発表しました.

諸田さんは,レーザ計測点群と画像のレジストレーションや画像認識による地図作成について,実用化のための精度不足の困難点を話しました.実務でMMS計測のことを伺い,早い時期に整備したMMS車のコストにびっくりしました.近年精度が高くなって一方,コストも減少したことがわかりました.

嶋野くんは,統計的形状解析と主成分分析による山の特徴を示しました.山の特徴がアニメーションで可視化されて,形状の変動が分かりやすくなりました.分析結果により,富士山がかなり大きくて対称していることを改めて認識しました.データ分析時の注意点として,実際にデータがないところにモデルの挙動が合理的かということを議論しました.

次回は邱の進捗報告です.頑張ります!


The 5th student seminar was held on 11/27 (Mon.).
Mr. Morota (D1) and Mr. Shimano (B4) presented their research progress.

Mr. Morota talked about the difficulties of registration of laser point clouds and images and mapping by image recognition, which are not accurate enough for practical use. I heard about MMS measurement in practice and was amazed at the cost of MMS vehicles developed in the early days The increase in accuracy and decrease in cost are impressive.

Mr. Shimano showed the features of the mountains through statistical shape analysis and principal component analysis. The features of the mountains were animated and visualized, which made the variation of the shape easier to understand. The results of the analysis confirmed that Mt. Fuji is quite large and symmetrical. We discussed whether the model behavior is reasonable where no data is available, which is a point to keep in mind when analyzing the data.

Next time, Qiu will give a progress report. I will do my best!

投稿者|邱(Qiu)